Average exposure score
Both countries sit near the top of the core country-conditioned benchmark.
United States1.609
China1.659
Comparative diagnostic
Two countries near the top of the exposure distribution do not tell the same substitution story.
The United States and China both sit near the top of the country-conditioned exposure distribution. China is somewhat higher on average exposure and on the share of highly exposed tasks, but the more useful distinction is that China also leans more strongly toward substitution and goods-side intensity. The point is not only that both countries are highly exposed. It is that they are not highly exposed in exactly the same way.
What changes when two countries both sit near the top of the exposure distribution, but one is more substitution-heavy and more goods-intense than the other?
At a glance
At the headline level, both countries belong near the top of the global exposure distribution. China's average exposure score is 1.659, compared with 1.609 in the United States. The high-exposure shares are also close, at 19.4% in China and 17.4% in the United States. That similarity matters because it shows why the comparison cannot stop at ranking. Once two countries are already close near the top, the real question becomes what kind of exposure is dominating the profile.
Pathway proof point
The pathway layer helps separate countries that would otherwise look similar once we focus only on average exposure.
Why the average is not the whole story
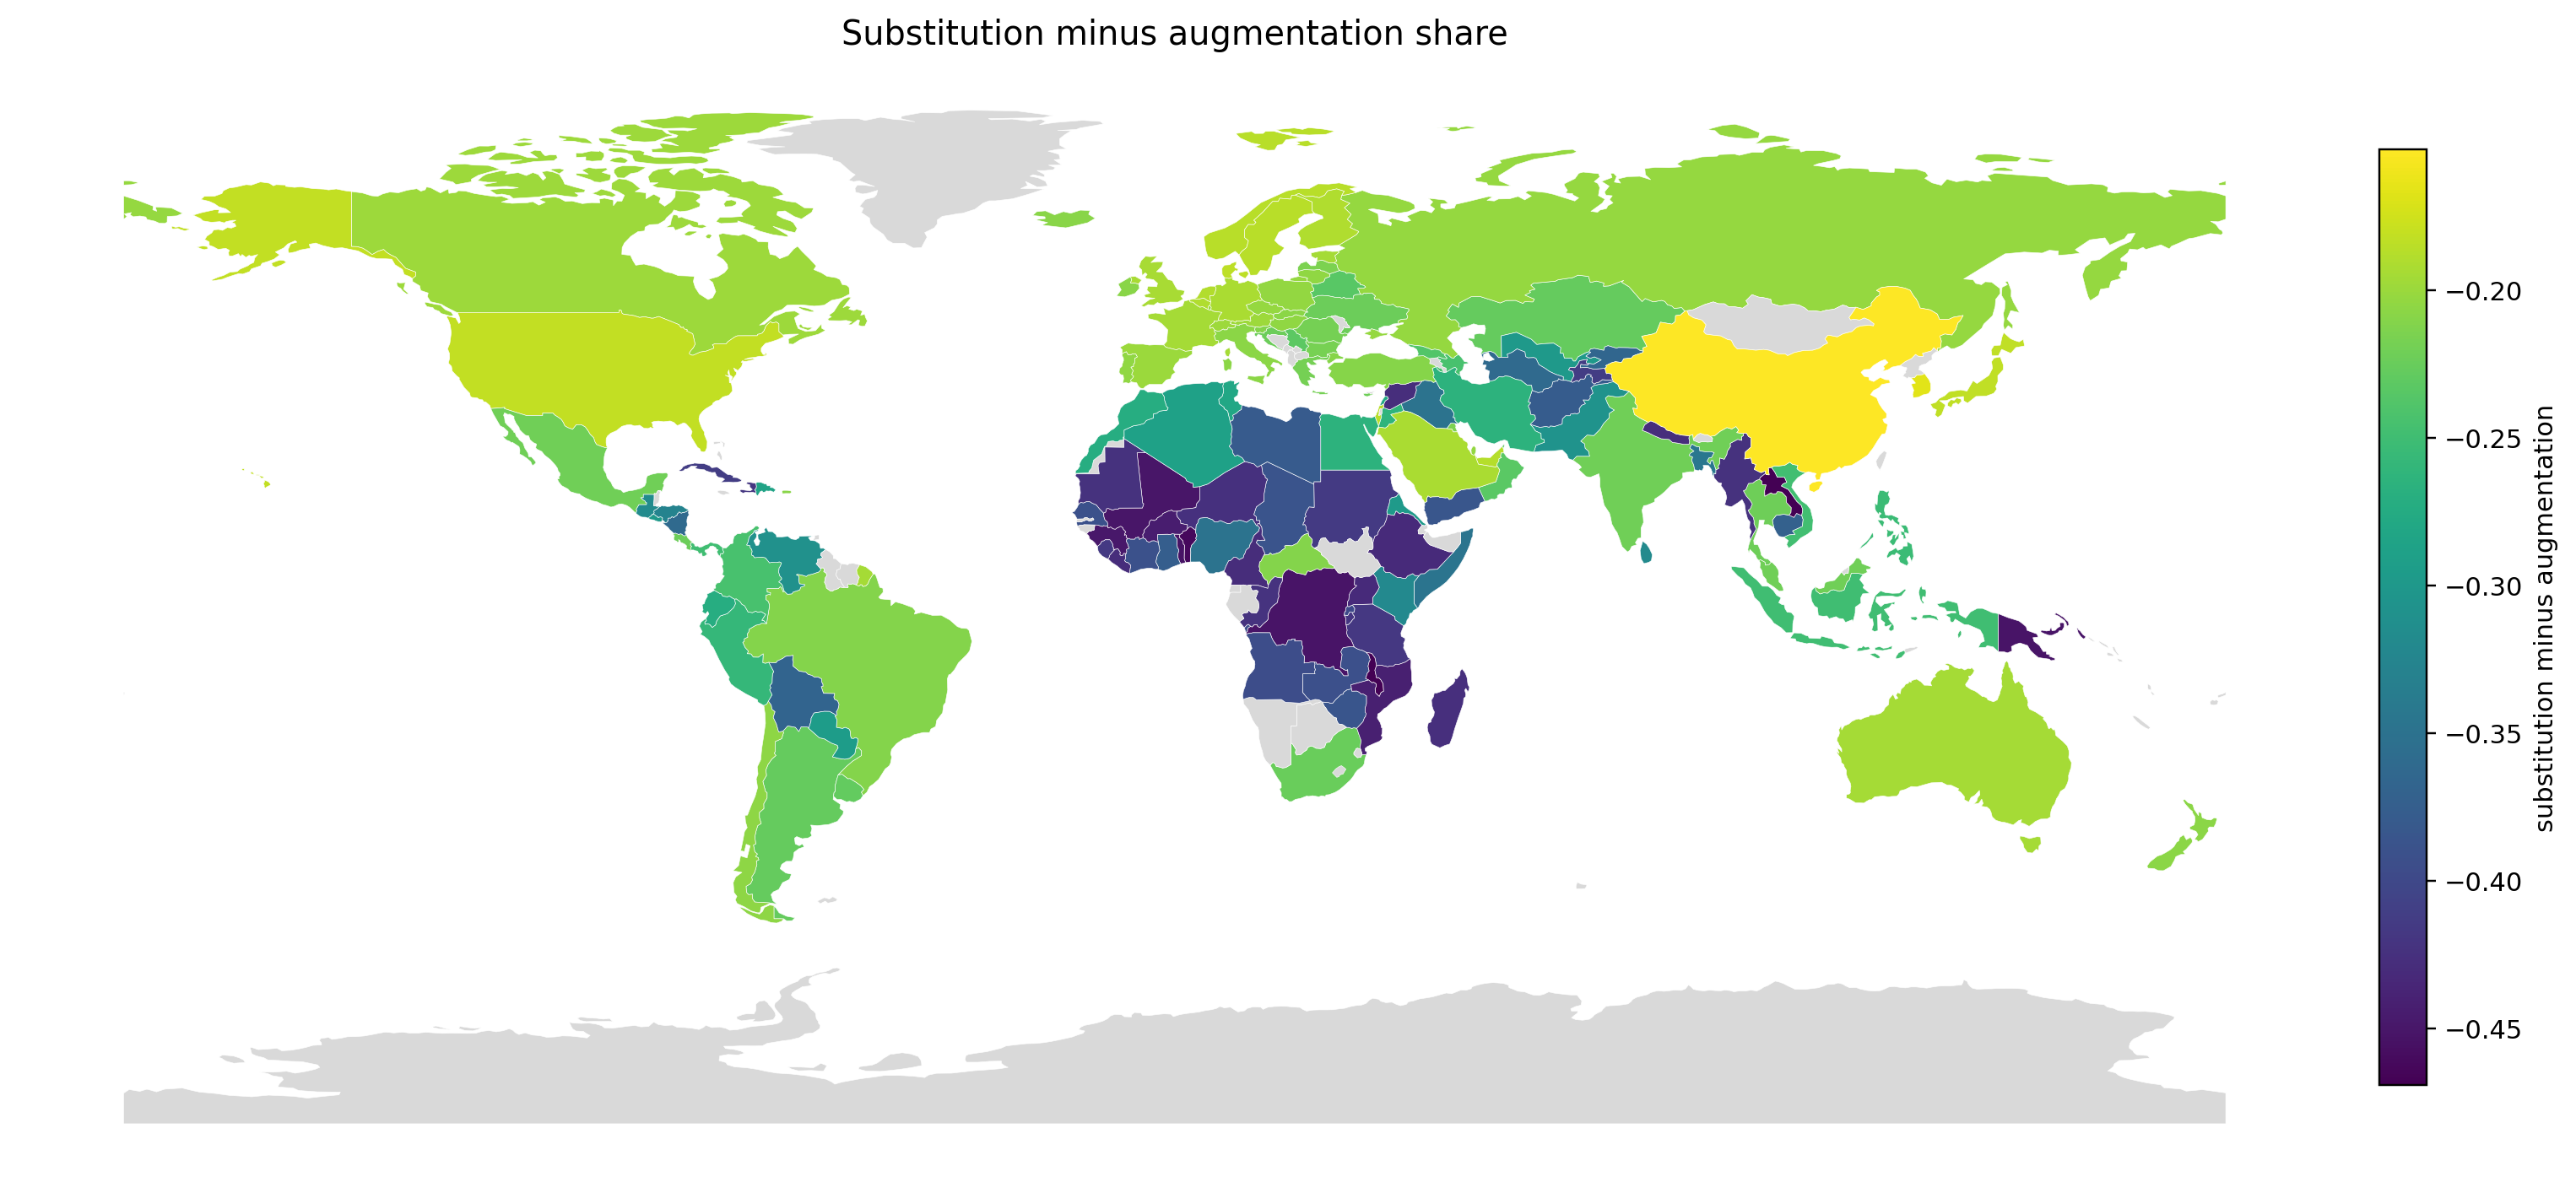
The pathway layer separates the two countries more clearly than the average alone. China's substitution share is 25.6%, compared with 22.0% in the United States, and its substitution-minus-augmentation balance is also larger. The comparison therefore does not say only that China is slightly more exposed. It says that China's high-exposure bundle tilts more strongly toward replacement-oriented exposure once tasks are classified by pathway.
Where the signals concentrate
The standout occupations point to a shared information-handling world of work, but not to the same concentration. In the United States, the top signal sits in bookkeeping, accounting, and auditing clerks. In China, the top signal appears in graders and sorters of agricultural products, alongside claims processing and switching roles. The comparison suggests that both countries combine clerical and routine information-processing exposure, but the exposed task bundle is organized somewhat differently across office and production-linked roles.
United States
China
What to remember
The useful lesson is not that the United States and China are both near the top and therefore tell the same story. The more useful lesson is that similarly high exposure can still arrive through different pathway balances and different goods-side structures. That matters for interpretation. The policy and adjustment questions raised by a more substitution-heavy, goods-intense profile are not identical to those raised by a similarly exposed but somewhat less substitution-heavy one.
The United States and China both sit near the top of the country-conditioned exposure distribution.
China's exposed task bundle is more substitution-heavy, so similar aggregate exposure does not imply the same pathway balance.
China is higher on overall goods-facing automation intensity, while the United States has a larger direct-execution share inside the goods layer.
What to compare next
The comparative diagnostics should open back out into the atlas rather than end on a single story page. These are the most useful next steps from this pair.